
10 Sep, 2020
WORLD RESOURCES INSTITUTE: Interactive map of eutrophication and hypoxia
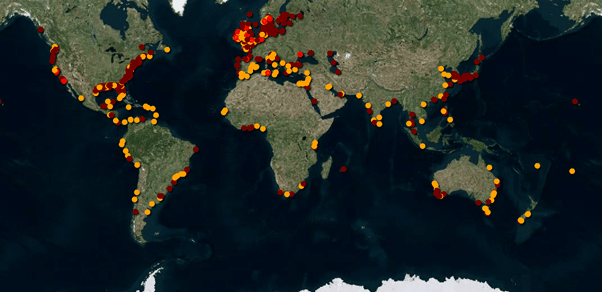
The World Resources Institute has provided an interactive World Map that shows reported cases of eutrophication and hypoxia both past and present. Periodic hypoxia has been documented in areas such as Florida since the 1980s but with the rise in global temperatures and increase in nutrient loading in water-systems, the world has witnessed a significant increase in harmful agal blooms.
WORLD MAP OF EUTROPHICATION AND HYPOXIA (WRI)
The problems faced in Florida are certainly not unique. In 2014, a toxic algal bloom in Lake Erie forced the city of Toledo to shut down its drinking water system, leaving more than 400,000 people without access to water. Cases span from Beijing (algal blooms recorded in the Yellow Sea just prior to 2008 Summer Olympics), to South America’s west Coast, Chile – where in 2016 the salmon farming industry lost $800 million due to algal blooms that caused widespread fish killings. Only last year, did Australia witness a similar mass fish killing in the Murray Darling Basin as a consequence of years of prolonged water shortages and toxic levels of cyanobacteria.
In amidst the pandemic, Brazil now faces extreme levels of water resource disparity, coined as the ‘Brazil COVID water crisis’. Brazil is not alone in the concerns for water quality and management going forward. The WRI map of global eutrophication shines a heavy light on the problem we face across many nations – one that will only continue to get worse with poor waste management and rising global temperatures.